


Westside Toastmasters is located in Los Angeles and Santa Monica, California
M - Measuring Your Performance
Think about your favourite sports team. Have you ever noticed how well the players perform compared with people in your organization? Why is this so? One reason is that people on a sports team always know how they are doing. Their performance is measured so they can see and feel the effects of their efforts. And they can celebrate achievements or identify opportunities for improvement.
One of the most effective ways to measure team performance is performance indexing. The system is based on the balanced scorecard concept, in that it can
measure a number of indicators on one scorecard;
reflect the interests of the customers, shareholders, and staff simultaneously;
measure the past (financial results), as well as the future (innovation).
Performance indexing is a powerful tool for motivating a team or its individual members. You can use it to
plan improvements;
set goals;
review achievements;
celebrate improvements.
Take these steps to set up your own scorecard:
Step 1.
Define why you come to work. Create your own mission.
Before creating your scorecard, you need to define your purpose. This purpose, or mission, should be based on the mission of your organization. For example, if your corporate mission is to provide exceptional service and be the supplier of choice, then your mission should reflect similar lofty ideals. A simple formula for writing up a mission is to answer these six questions:
Who are you? Write your name and job title (1).
What do you do? Describe what you do (2).
How do you carry out this activity? Describe key dimensions, such as timeliness, quality, or cost-effectiveness (3).
Who do you serve? Describe your customers, specifying their market segments, if necessary (4).
Where are your customers? Describe your geographic coverage (5).
Why do you do this job? State benefits for yourself, the customer, and the organization or department (6).
Once these questions have been answered, put them into the framework below.
| Who | ________ | What | ________ |
| (1) | (2) | ||
| How | ________ | Who | ________ |
| (3) | (4) | ||
| Where | ________ | Why | ________ |
| (5) | (6) |
Create a sentence or two from the above elements to serve as your mission statement.
Step 2.
Identify key performance indicators that will track whether you are operating according to your mission.
Identify the most important categories of performance. These categories typically relate to
quality (satisfying the customer the first time);
timeliness (responsiveness of service);
cost-effectiveness (profitability);
health and safety;
your satisfaction.
Where possible, pick performance indicators that are
easy to collect;
readily available;
accurate;
within your control/influence.
Step 3.
Determine existing performance levels.
Average your performance over the previous three months or another period. As you gather data, you will see how suitable your indicator is. If, for example, it becomes extremely costly to collect information, the indicator's value should be questioned.
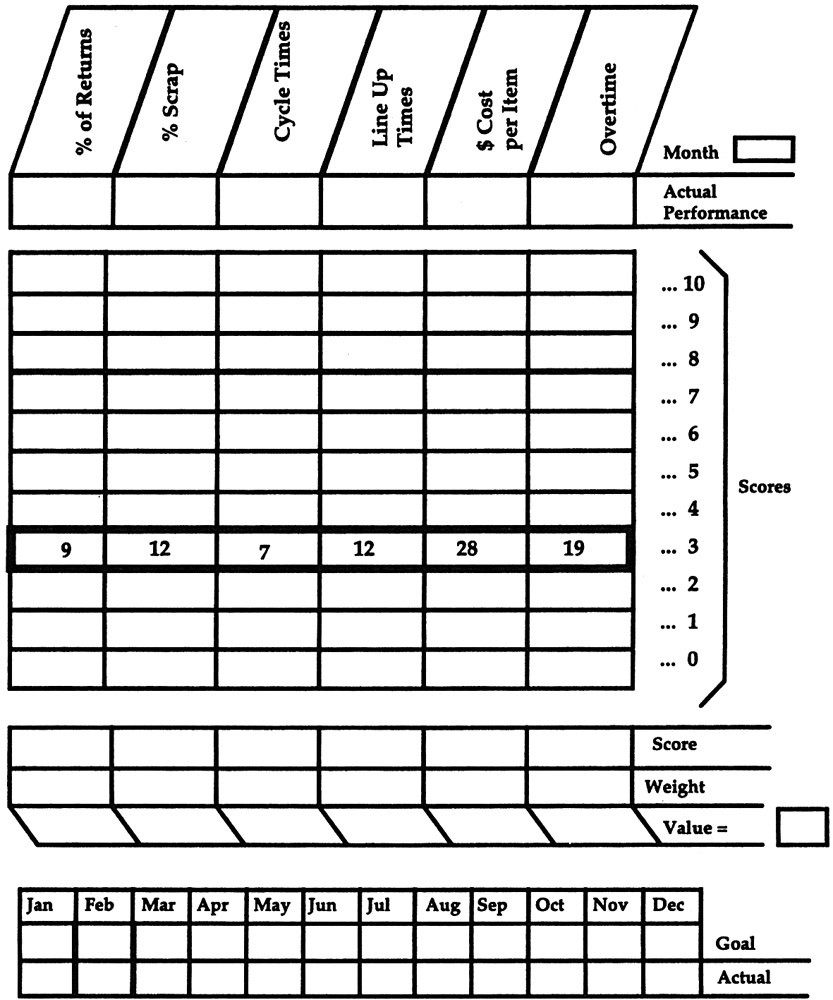
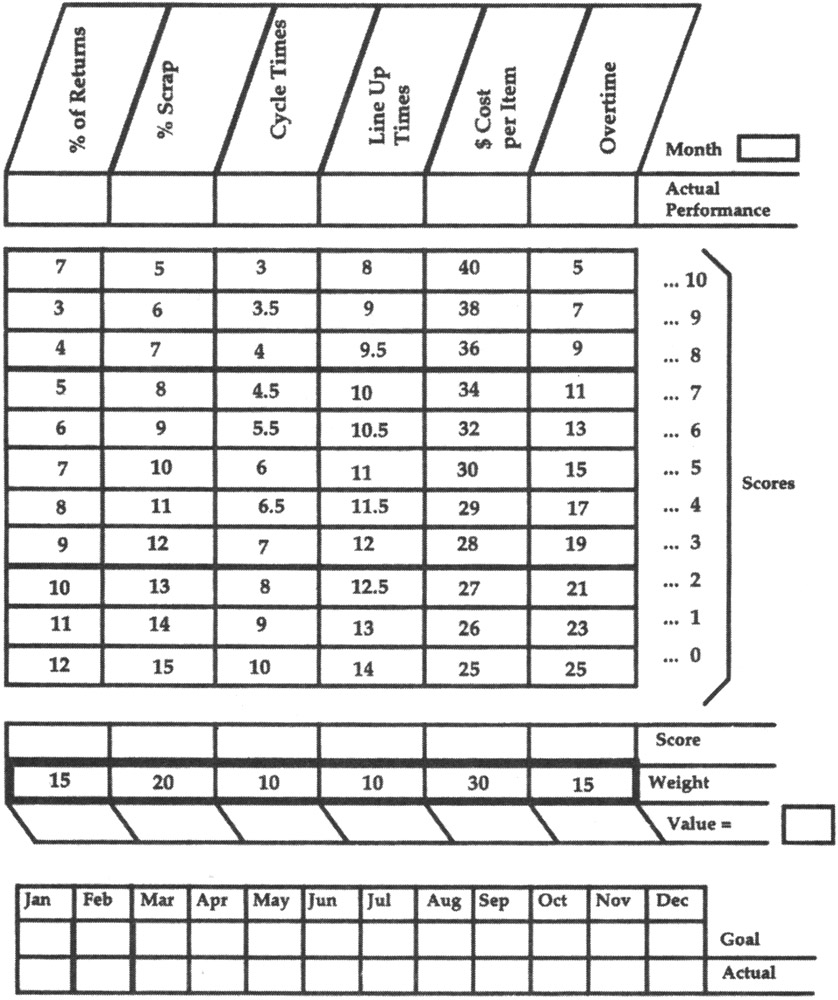
Current performance levels should be entered into the matrix that appears on the next page. Enter information in the boxes corresponding to the score of 3 to provide more room for improvement than for decline on the 0–10 scale.
Step 4.
Your goals should be
specific;
challenging;
measurable.
realistic;
attainable;
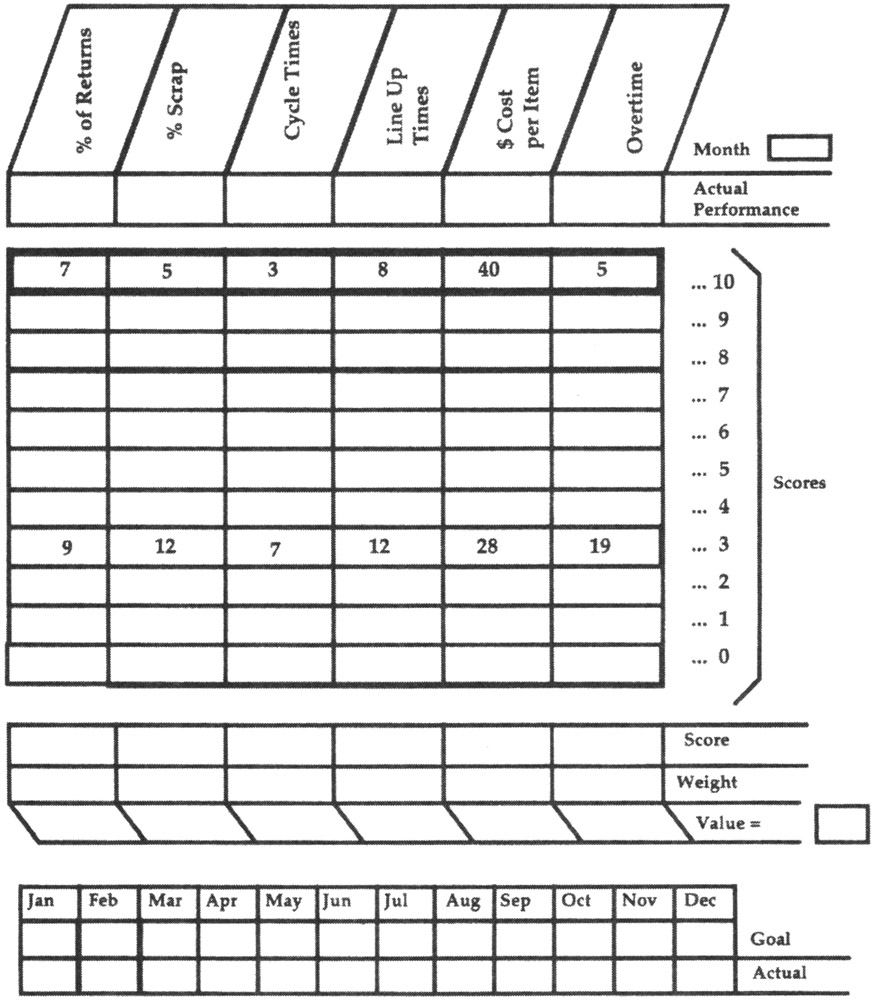
Then enter your goals into the matrix at the level corresponding to the score of 10 (see below).
Step 5.
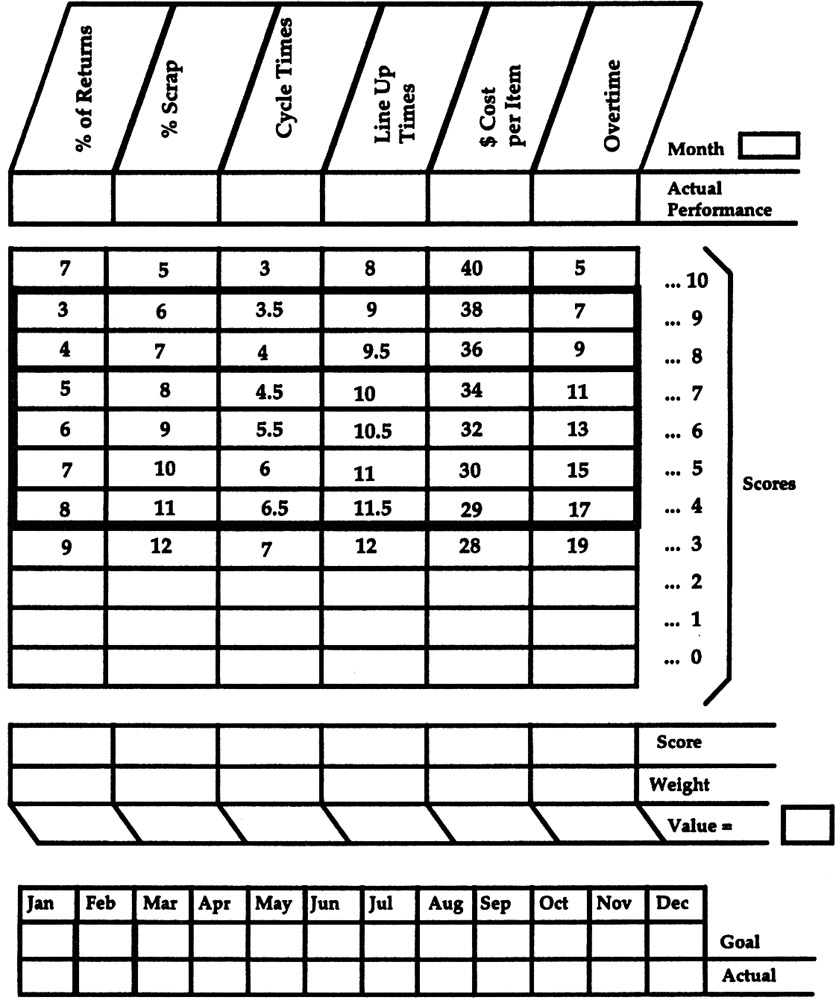
You will not be able to improve from a score of 3 to 10 overnight. It may take you a year to do this. Therefore, it is important that you are able to track your progress towards the final goal. Mini-goals will help you measure your improvement.
These mini-goals are entered in the matrix at the levels corresponding to the scores of 4, 5, 6, 7, 8, and 9, as below.
Step 6.
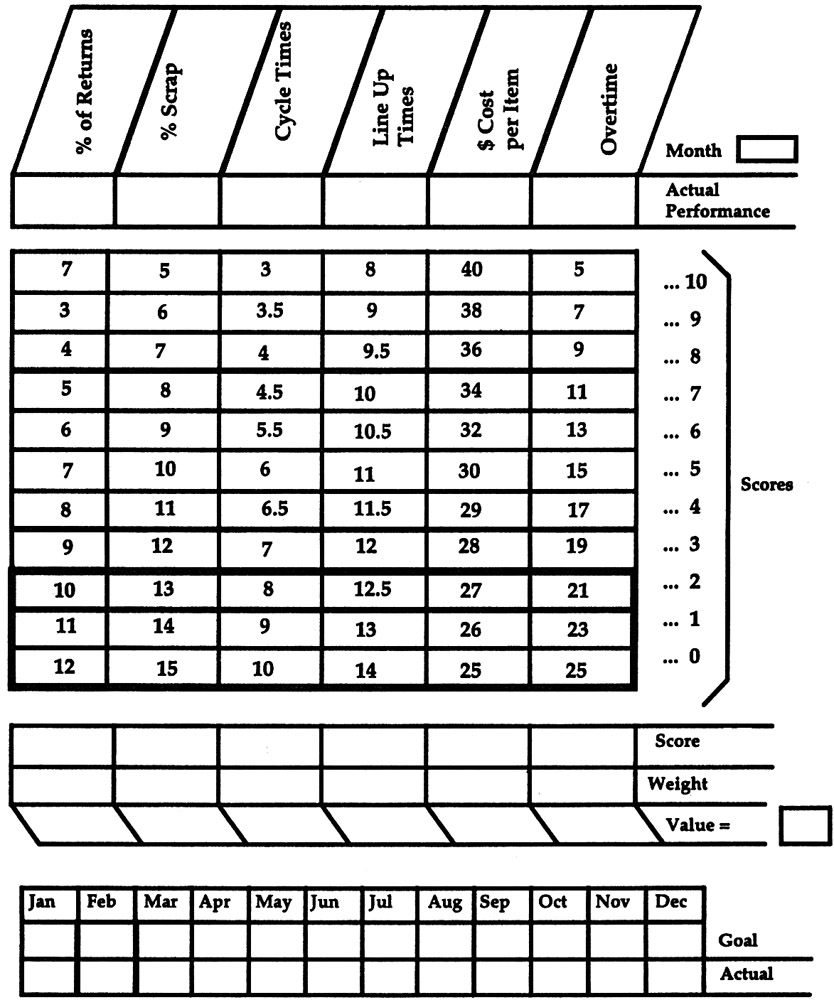
Establish the lower performance levels.
Record the lowest possible level of performance. This allows any decline below your current performance level to be captured.
Step 7.
Decide on the relative importance of each of the chosen indicators, then assign them a weighting. These weights should add up to 100 percent. (This weighting, multiplied by the score, will allow the team to calculate its overall performance for each period.)
Step 8.
Allow for a period of development.
Wait a month or two before confirming the final scores. During that period
confirm that current performance levels are a fair reflection of the starting point;
establish that the data for the chosen indicators are easy to collect;
devise the simplest way to collect accurate data;
confirm that the weighting is a fair reflection of the mission;
develop a plan for the maintenance of the system and for data collection.
Step 9.
Plan for improvement.
Develop action plans that will improve performance in all areas. Ensure that these actions
are spread over a reasonable period - so that you do not try to do too much too quickly;
are things you have control over;
have the support of your immediate supervisor.
Step 10.
Tabulate scores and calculate the index at the end of each period.
At the conclusion of each monthly period, you should gather data and plot the results on your chart.
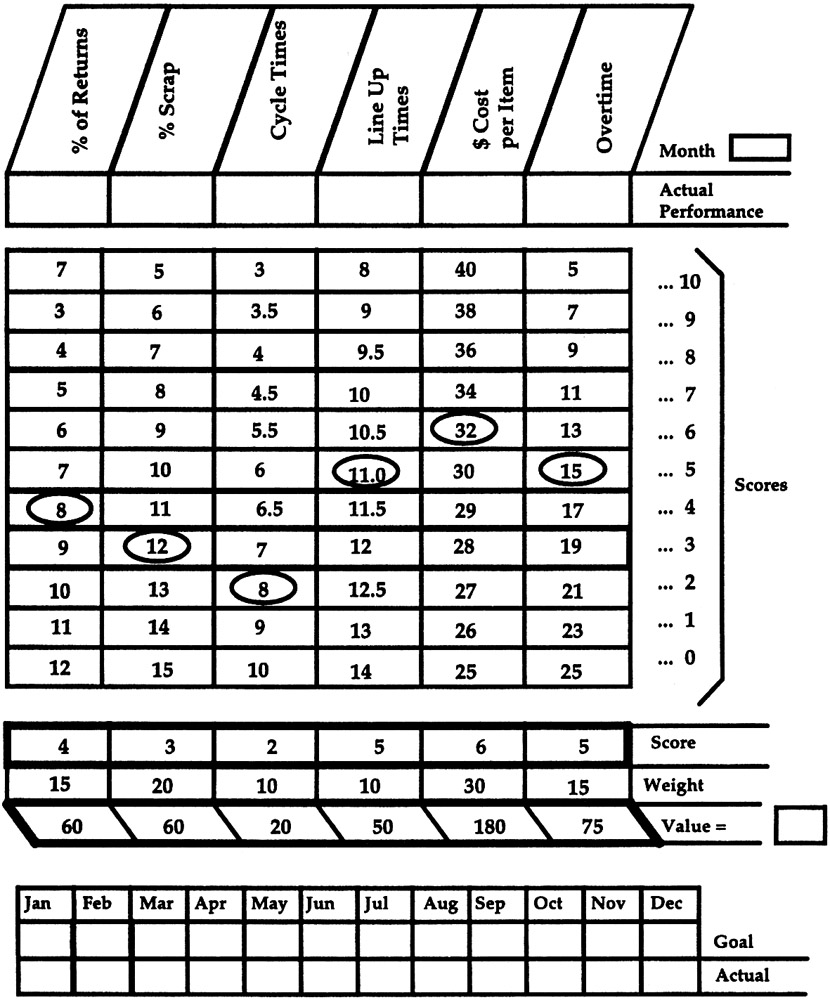
Calculate the actual measure for each productivity indicator and enter it on the performance line of the matrix.
Circle the actual performance level achieved for each indicator on the scale. If a mini-goal is not achieved, the lower performance level should be circled. Any performance level lower than 3 gets 0 for the period.
Score the corresponding performance (1–10) and enter it on the score line of the matrix.
Mulitiply the weighting factors by the score to get a weighted value. Enter the totals on the value line of the matrix.
Add the weighted values together. The sum should equal the performance index for that monitoring period.
Review your performance with your boss regularly. Send her a monthly copy with any appropriate comments.
Step 11.
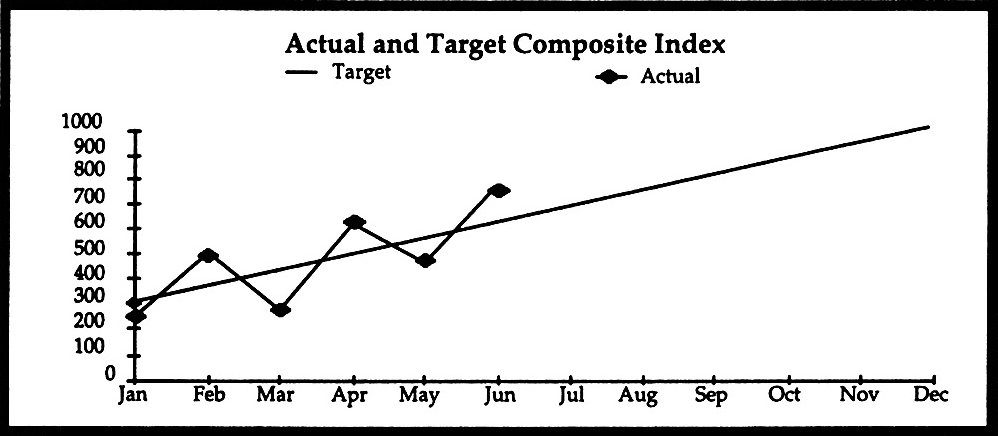
The performance should be plotted on a graph against a target curve that starts at 300 and ends at 1,000, as below. A three-month moving average may be used to accommodate variations.
Westside Toastmasters on Meetup