


Westside Toastmasters is located in Los Angeles and Santa Monica, California
Milestones: Getting the Terms Straight
In order to break away from the insanity referred to euphemistically as forecasting, a number of complementary components are necessary:
Sales-Primed Communications, designed to position offerings specific to title, vertical industry, and goal, which provides less subjective input into the pipeline
Auditable correspondence between the seller and the buyer
Sequences of Events containing estimated close dates, as negotiated with the buyer
Companywide milestones, with defined ways to achieve and document them
Sales managers (not salespeople) who are willing and able to audit milestones, grade pipeline, disqualify low-probability opportunities, and predict what will close
Senior executive commitment to ride through potential "push back" from salespeople and sales managers who prefer less visibility and accountability
Items 1 through 3 have been described in previous chapters. So let's start with Customer Focused Selling milestones, which most of our clients modify as needed and adopt as companywide standards. First, refer to Figure 15-1.
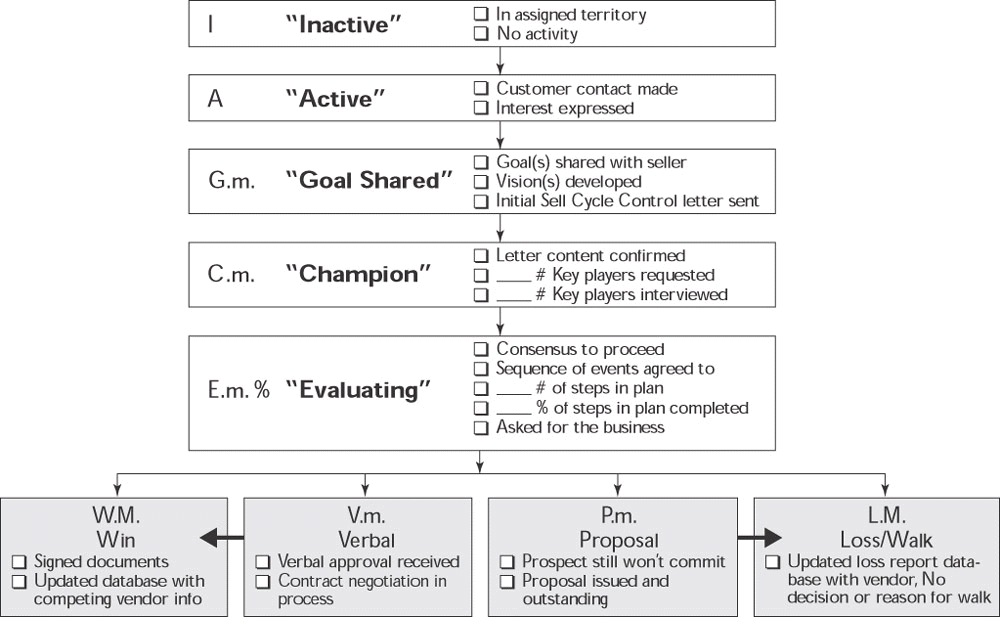
Figure 15-1: Grading Opportunities: Funnel Milestones (m = no. of months; M = total no. of months; % = % complete)
Inactive means that an account fits a company's target market and is assigned to a salesperson, but there is no current activity. A salesperson's business-development efforts should focus on getting a buying cycle to start by getting a targeted Key Player within the account to share a goal, which would advance it to the next milestone.
Active indicates that contact has been made and some form of interest on the part of the customer or prospect has been expressed.
Goal Shared is the initiation of a sales cycle in Customer Focused Selling; it indicates that a targeted Key Player has shared a desire to achieve at least one goal that is on the menu of business issues the seller can help them address.
Champion status can be granted only by the sales manager. It happens only after all the qualification elements have been achieved: the letter or email has been sent; the buyer has agreed to the content; and the buyer is willing to provide access to Key Players. The sales manager must have reviewed the customer document and graded it as a C, usually after a brief discussion with the salesperson.
The opportunity remains a C while all Key Players are being interviewed, either in person or on the phone. All calls should be documented with each buyer, and there should be agreement that the content reflects the conversation that the seller had with them. After all Key Players have been qualified, there is an attempt to qualify the opportunity. Some of our clients like to not only track the number of months an opportunity is at this level, but also get a sense for how many Key Players must be interviewed and how many have been called on. A greater number of Key Players most likely means that an opportunity will remain a C for a longer period of time.
Evaluating status is determined by the sales manager, but only after the salesperson has gained consensus from Key Players that further investigation of the salesperson's offering is called for, and a Sequence of Events has been accepted by the buying committee. At the end of that month, the salesperson provides a copy of the cover letter and Sequence of Events, and the sales manager can change the status to E (and update the Sales Force Automation/Customer Relationship Management (SFA/CRM) system) if it is deemed a qualified opportunity.
Opportunities remain at this stage until one of three things happens:
The buyer withdraws (and the opportunity becomes a loss).
The seller withdraws (and the opportunity becomes a walk).
The seller asks for the business after the Sequence of Events has been completed.
Once the seller has asked for the business, the opportunity goes into one of four grades:
W (Win) |
An order with all necessary documents signed. |
L (Loss) |
The buyer informs you that he or she will not be moving forward with you. |
V (Verbal) |
The buyer has given you a verbal commitment to go forward. |
P (Proposal) |
A proposal is provided to the prospect with a decision due. |
A few notes about the chart. Many of our clients choose to assign probabilities to the G, C, and E grades. Until you accumulate your own historical data with your forecasting system, we suggest assigning initial probabilities of 25 percent for the Champion (C) level and 50 percent once the manager assigns the Evaluating (E) level to an opportunity. (Organizations with SFA or CRM systems may ultimately collect percentages for individual salespeople, enabling them to fine-tune forecasting accuracy.) For an E prospect, each checkpoint agreed to increase the chances of getting an order.
Capturing the number of months (m) that a line item in the pipeline has been at a particular stage allows the sales manager to identify opportunities that are not progressing. For E status, adding a percentage to reflect the percentage of steps in the Sequence of Events that have been completed can also provide a meaningful point of reference for the manager. For the grades of W and L, it may similarly be useful to track the total number of months (M) that an opportunity was in the pipeline before you won or lost. After losses, data indicating whether the winner was a named competitor or there was no decision (meaning no gold medal was awarded) should be entered.
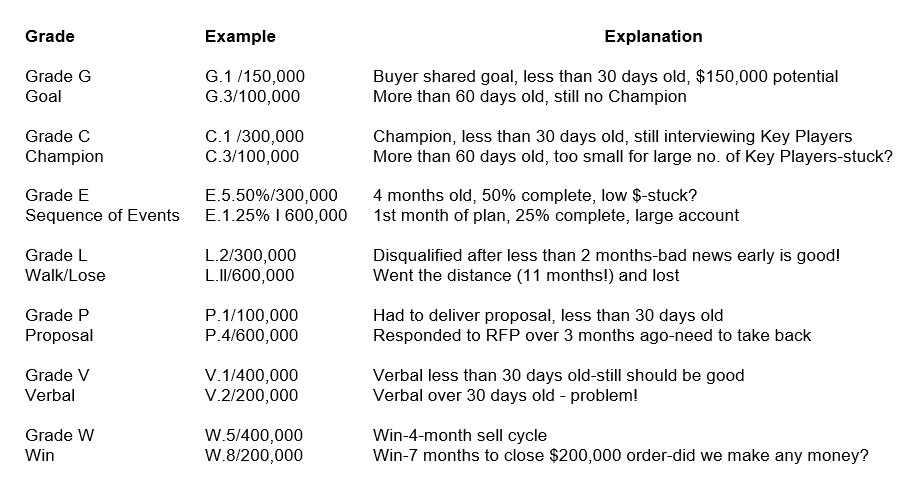
By implementing the system shown in Figure 15-2, managers can detect early-warning signs that a given opportunity is stalled or in trouble. For each pipeline milestone shown, you'll see two examples: one that is on track, with normal parameters for a viable opportunity; and another that is beyond normal conditions. While there may be extenuating circumstances, the latter situation should prompt the manager to have a conversation with the salesperson. If necessary, both can agree on a course of corrective action to get the opportunity back on track. Alternatively, it may be appropriate for the manager to disqualify this line item from the pipeline, rather than allow the seller to toil with a low probability of getting the business. (Remember: Bad news early is good news.)
Even without an SFA/CRM system, sales managers can now forecast by asking each salesperson to email the latest copy of the Sequence of Events for each opportunity. By reviewing these documents, the sales manager can assess each opportunity with a reasonable degree of objectivity and consistency (in an apples-to-apples sense).
In order to home in on forecasting accuracy, we suggest that sales managers maintain three pipeline categories for each salesperson:
Add-on business with existing customers, having the highest probability of closing
New account business in which you were proactive and started as Column A
New account business where you were reactive and started as Column B, C, and so on
Forecasting is now a monthly review of pipeline, with sales managers choosing which opportunities are likely to close and the Sequences of Events providing lots of visibility and realistic close dates.
This monthly review also affords an opportunity to be proactive with salespeople who might be procrastinators. "Train wrecks" within a funnel do not happen overnight. Let's see how a manager can be proactive in anticipating a shortfall in a given funnel. A few variables are necessary to provide sales managers with visibility one sales cycle ahead, as shown in this example.
A salesperson's annual quota: $1.5 million
The average length of a sales cycle: 4 months
The probability that an E will close: 50 percent
One way to reduce procrastination is to break down a quota to a monthly number—in this case, $125,000/month. Multiplying this by an average sales cycle tells you that in 4 months, a salesperson will be expected to close $500,000. If, however, the salesperson closes 50 percent of the Sequences of Events that were put in place, the funnel target would be twice that figure, or $1 million. This means that at any given time, when you take a snapshot of a salesperson's funnel, you would like to see at least $1 million at E status, as graded by the sales manager. If you were halfway through the year and the salesperson was $100,000 behind the YTD number, the target would be the standard of $1 million plus ($100,000/50 percent), or $1.2 million.
This may seem like a mouthful, so let's look at the activity balancing example below, where the per month quota is $125,000, the average sell cycle is 4 months, and there is a 50 percent probability of closing a Grade E prospect.
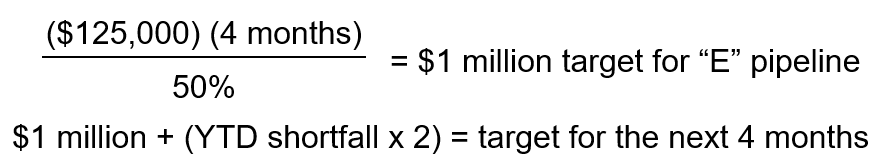
By doing this calculation on a monthly basis, sales managers can help salespeople stay ahead of the curve. While managers should review changes to, and volume of, A, G, and C entries, E opportunities provide the best sense of how things will look one sales cycle ahead. If the E funnel is below target, business development activity must be increased. The conversation could sound like this:
Jane, you have been running on your numbers through April, but this month you only have $800,000 in E business. Over the next month, I want you to make sure that you increase your business-development activities. My suggestion would be to make a minimum of 10 new contacts per week. I'd also like to see you migrate two opportunities from C to E, and I will work with you on doing that. Hopefully, next month you'll have sufficient new opportunities in your funnel so that we'll both feel better about where you'll be YTD in September. We can then revisit how much of your time should be spent on business development.
This approach, in other words, emphasizes proactive rather than forensic sales management. If a salesperson competes for 8 months and loses, it is no longer solely his or her responsibility. Each month (or more frequently), the sales manager should have made a qualify/disqualify decision at all checkpoints in the Sequences of Events that were approved. The Sequences of Events also allow a sales manager to get further upstream on opportunities, to coach new or struggling salespeople all along the way, and to have control and ownership of the forecast he or she provides.
When these kinds of analyses are performed on a monthly basis, course corrections can be made to maximize the probability that salespeople will achieve their numbers—and thereby minimize turnover, either voluntary or involuntary. Involuntary turnover, as suggested above, is difficult for all parties involved. From the company standpoint, there is a significant expense inherent in recruiting and training a replacement, lost continuity within the territory, ramp-up time for new hires, and management time spent on the territory during the interim period. By the time many managers (and salespeople) realize they are in trouble, it is often too late to save that year. An analysis on a monthly basis, therefore, is well worth the time it takes to perform.
In a previous chapter, we distinguished between "will not" and "cannot" attitudes in a salesperson. "Will not" is, in most cases, a management issue. "Cannot" is a skill issue, and will serve as the basis of the next chapter.
Westside Toastmasters on Meetup